
3D Graphics Rendering
2026
-
Uniform Evaluation Metrics
The following (work in progress…)
The following metrics are full-reference metics like the conventional PSNR and SSIM.
- FLIP
- LPIPS: git
- pu-PSNR
- ColorVideoVDP: Here is the Project Page and git repo.
- Intel’s CGVQM
Black Box Approaches
1. NVidia’s FLIP
FLIP is an excellent tool for visualizing and communicating errors in the rendered images, both for low dynamic range (LDR) and high dynamic range (HDR). Big thanks to the NVlabs for making the tool publicly available with the source code. The FLIP is a command line interface (CLI) tool. I am on Windows platform:
- First,
git clone --recursive https://github.com/NVlabs/flip.git, thencd flip - BUILD:
mkdir build
cd build
cmake ..
cmake --build .
After this, the
flip.exeshould be under build/Debug. Similar way this can be extended toDebugandReleaseversion. As per discussion,Releasemode performs better
// for Release mkdir Release cd Release cmake -DCMAKE_BUILD_TYPE=Release .. // for Debug mkdir Debug cd Debug cmake -DCMAKE_BUILD_TYPE=Debug ..- RUNNING
// go to Release/Debug folder and run
.\flip.exe -r .\reference.png -t .\test.png
// similarly
.\flip.exe -r .\reference.exr -t .\test.exr
Visually, color represents the error map.
Blackmeans no perceived error, andyellowrepresents high error. For more details, see the Technical Blog and the Flip Publication.
There is an UI version of FLIP implementation, named as FLOP. Find in git with the blog explaining every step clearly. However, I guess the repository is not well-updated (2025) and there are several bugs that need to be resolved.
2025
-
Perceptual Evaluation Metrics
(work in progress…)
The evaluation of 3D rendering content under immersive experiences, i.e., extended reality (XR), is challenging and primarily user study-dependent. However, the subjective assessment is time-consuming, expensive, and user-biased. On the contrary, the objective evaluation metrics are fast, mathematically accurate, and more reliable. Nonetheless, the conventional pixel-based approaches, e.g., MSE, PSNR, and SSIM, fail to assess the true human evaluation process. Conversely, the perceptual evaluation metrics under the Visual Difference Predictor (VDP) genre are the most accurate evaluation strategy.
Foveation-Considered Metrics
VDP (HDR-VDP) genere metrics also referred to the
White Box Approaches.However, the current popular VDP models have several limitations. For instance, HDR-VDP-2 is limited to achromatic and static; FovVideoVDP considers spatio-temporal with foveation; however limited to the achromatic; and ColorVideoVDP considers spatio-temporal, chromatic, XR-ready, differentiable; nonetheless, still lack explicit binocular 3D modeling and comfort prediction.
FovVideoVDP
The FovVideoVDP is a video/ image difference metric that models the spatial, temporal, and peripheral aspects of perception (See project page, git repo). It is a full reference metrics and to the best of my knowledge, this is the only metric that considers eccentricity and foveated aspect of vision. Unlike the other metrics, e.g., PSNR, SSIM, FovVideoVDP requires the physical display data (e.g.,
standard_4k,standard_fhd, viewing conditions (size, resolution, peak luminance, viewing distance, etc.). It works with both SDR and HDR content.The FovVideoVDP reports a quality score in JOD (Just-Objectionable-Difference) units: 10 = no visible difference, lower is worse (can be < 0 for very strong/unrelated differences).
Use
Open terminal (e.g., Windows terminal or, Visual Studio Code or anyother) and install using
pip install torch pyexr pyfvvdpor simplypip install pyfvvdpshould also work fine. Afterwards, you can run:fvvdp --ref .\sponza_uni_0_32.png --test .\sponza_fov_0.png --display standard_4k --foveated --heatmap supra-threshold --output-dir out/ fvvdp --ref .\sponza_uni_0_32.png --test .\sponza_uni_0.png --display standard_4k --heatmap supra-threshold --output-dir out/For instance, here is a heatmap comparison between Crytek Sponza scene generated by uniform (constant 4 samples-per-pixel) path tracing (FovVideoVDP=3.8321 [JOD]) and foveated (maximum 4 samples-per-pixel and minimum 1 sample-per-pixel with different degradation strategies) path tracing (FovVideoVDP=3.4431 [JOD]) with respect to the uniform (32 samples-per-pixel) path tracing. For foveated evaluation, use the
--foveatedcommand. Figure 6 is the FLIP evaluation (Mean: 0.201726, Weighted median: 0.263627, 1st weighted quartile: 0.182165, 3rd weighted quartile: 0.353026, Min: 0.001038, Max: 0.703269) between the uniform (4 samples-per-pixel) and foveated (max 4 samples-per-pixel) heatmaps (uniform, fig 4 and foveated, fig 5) generated by FovVideoVDP.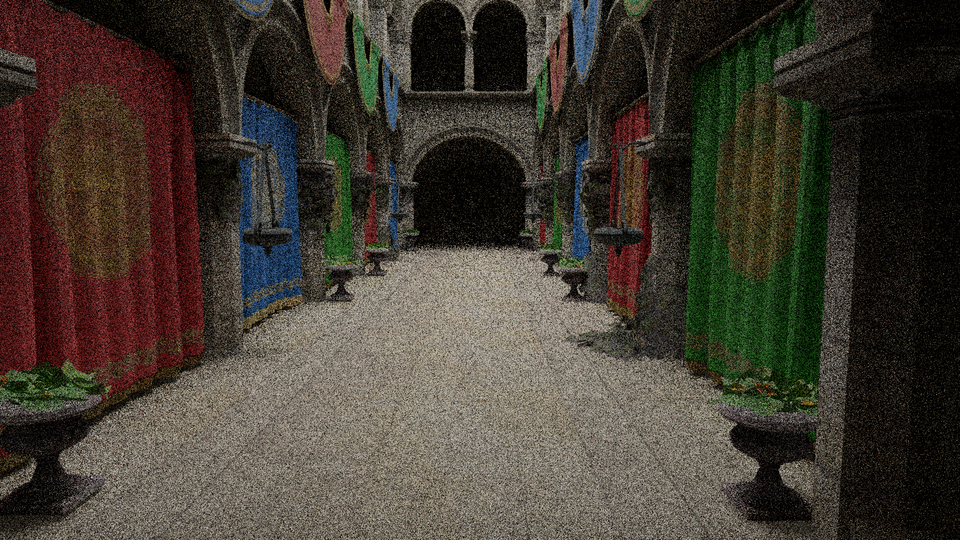
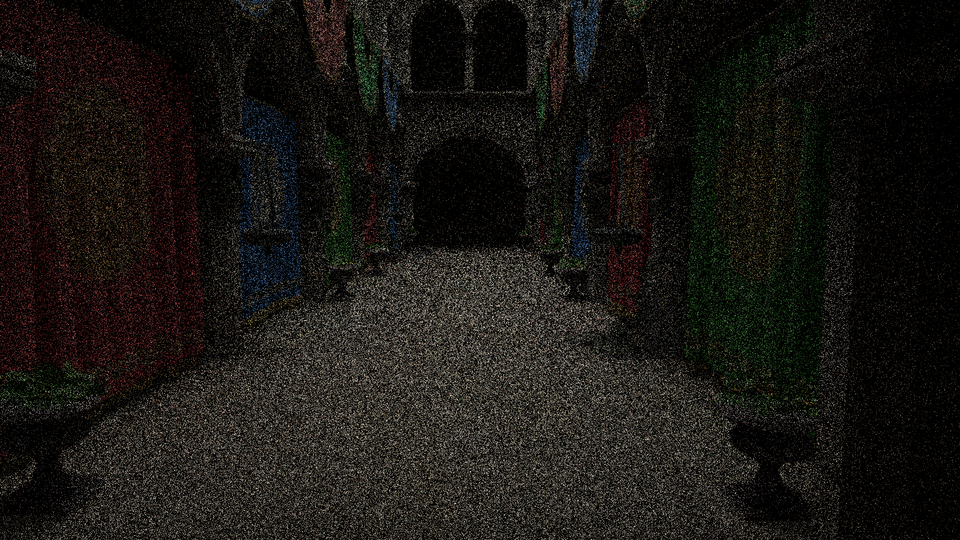
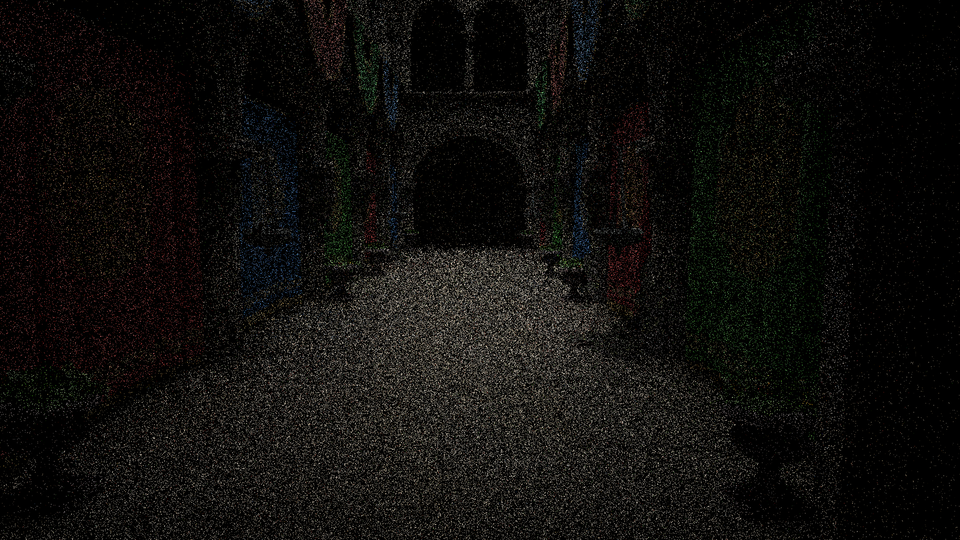
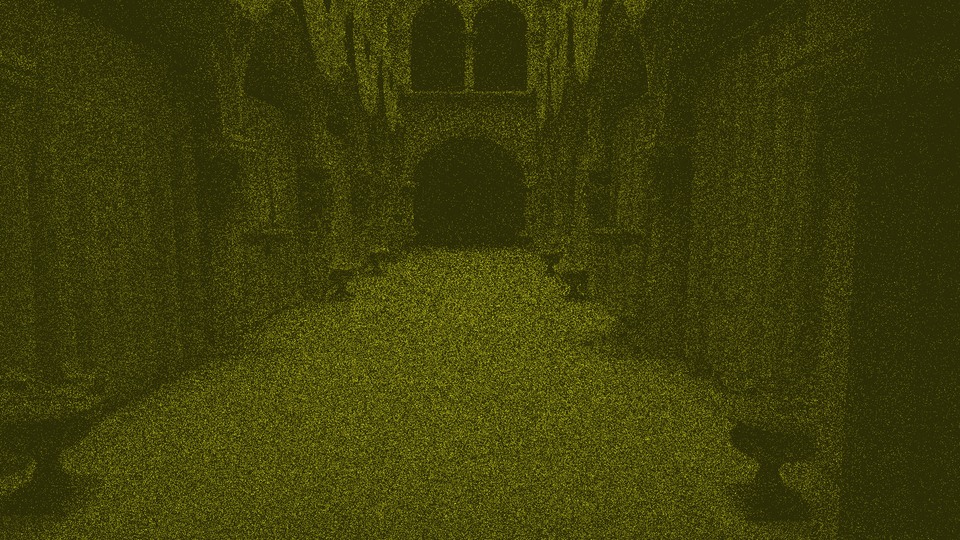
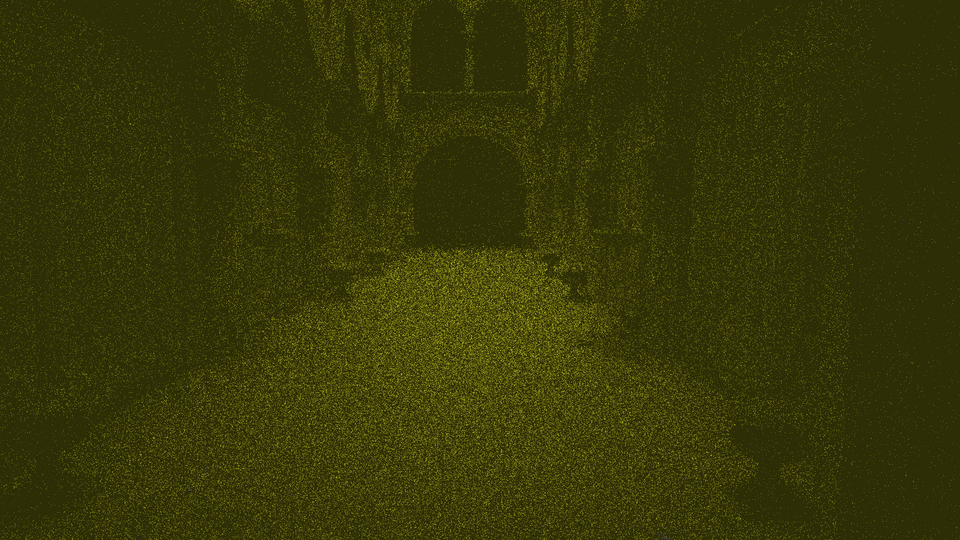
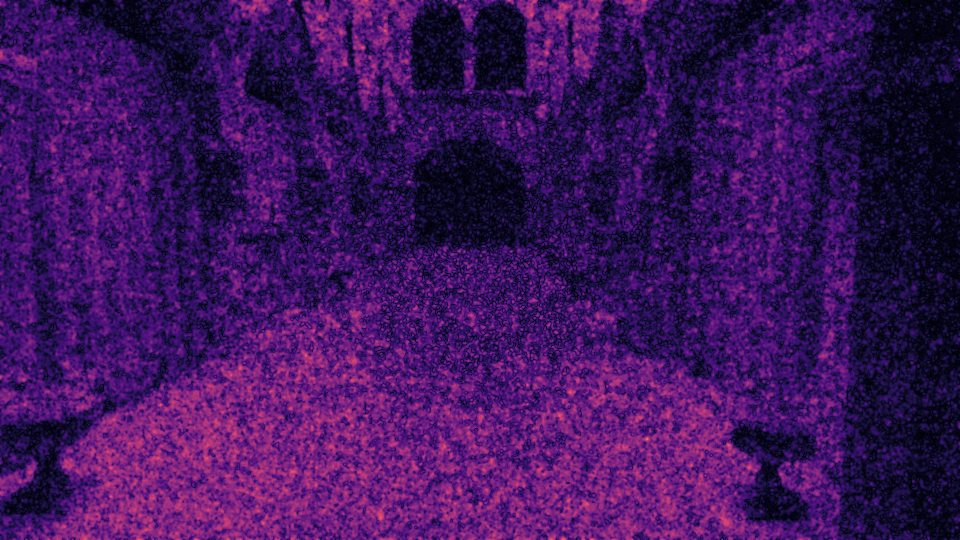

Figure 1. Foveated Path Tracing Evaluation.
p.s., FovVideoVDP also can perform batch evaluation, for instance
fvvdp --ref "ref/*.png" --test "test/*.png" --display standard_fhd --heatmap supra-threshold --output-dir out/ -
Benchmarking and Profiling
(work in progress…)
In real-time rendering, often the frame rate (fps) is presented as the computational improvement. However, the frame rate sometimes miss the important evaluation criteria. Therefore, the frame time (aka. render time (in millisecond)) could be a better option. For more, see this excellent article.
Many of the existing graphics debugger tools work in this philosophy to evaluate per frame rendering time to find the drawbacks. Some of the popular debuggers are:
- NVidia: NVIDIA Nsight Graphics, NSight Developer Tools, NSight Visual Studio add-ons
- Microsoft:
- RenderDoc, RenderDoc UE Plugin (Vulkan, D3D11, D3D12, D3DR, OpenGL, OpenGL ES supported)
- PIX DX12, support DX12
- Visual Studio Graphics Analyzer on Windows, Linux, Android, and Nintendo Switch
- Intel: VTune, Graphics Performance Analyzer (GAP)
- AMD: AMD GPU PerfStudio, Radeon Developer Tools Suite, Radeon Ray Tracing Analyzer
Other than, there are several other debuggers, e.g.,
- awesome-benchmark
- TauBench: A Dynamic Benchmark for Graphics Rendering (Dataset Reference Frames from Tampere University’s VGA Group
- qv: histogram, pixel value inspection, and statistics of rendered image
- NVAPI and Shader Execution Recording
-
Statistics For Rendering Engineers
Some Statistical Analysis Tools
- G*Power often used to determine the sample size (aka. number of participants) based on the statistical method/s will be used
- Two tools I find very handy, i.e., jamovi and jasp for do the analysis without writing any additional line of code
- Many researchers rely on the statistical software like IBM SPSS or R-Language
- Other than those, the Python is the most powerful for data analysis.
Pythonthere are numerous libraries, e.g., NumPy, SciPy, Pandas are frequently used. Additionally, someone could check Python pingouin for statistical analysis. Someone can usepandasfor data manipulation,SciPyorstatsmodelsfor tests, andmatplotliborseabornfor plotting results. Moreover, If someone wants to work on eye-tracking data analysis, the package, pymovements is very handy.
-
Computer Graphics Resources
3D Model For Research
Here you can find some 3D scenes and models frequently used in the research papers.
- ORCA: Open Research Content Archive
- McGuire Computer Graphics Archive 👍🏼
- Benedikt Bitterli’s Rendering Resources 👍🏼
- Stanford 3D Scanning Repository
- Clara.io
- Frequently used small project scenes: Benedikt Bitterli’s Rendering Resources 👍🏼 👍🏽 (Falcor: download)
- advanced: Moana Island Scene: Disney
- HDRI light texture
- polygon heaven
- hdri heaven
- From GitHub
- Commonly used Scenes and Assets
- few good 3D models
- ray tracing references
- pbr database 👍🏽
- pbr-based databased for CG artists
2022
-
Objects and Materials Part 1 (Wavefront 3D Model Specification)
1.1. wavefront .obj
the OBJ format, the MTL format was used and documented by Wavefront Technologies in the 1990s in association with its Advanced Visualizer software. Object files can be in ASCII format
(.obj)or binary format(.mod). Vertices are stored in acounter-clockwise, and in object space (un-normalized).v: vertex- find in different ranges, e.g., 0.0-1.0,
- v 1380.6033 -115.9791 -782.5203
- v -0.122936 1.00032 0.35065
(x, y, z [,w])w is optional and defaults to 1.0
vt: texture (uv) position [-1.0 to 1.0] of each texture coordinate vertex- vt 0.5767 0.5096 0.0000 (sponza scene)
- List of texture coordinates, in (u, [,v ,w]) coordinates, ~these will vary between -1 and 1. v, w are optional and default to 0.~
vn: vertex normal, in(x,y,z)form- vn -0.1776 -0.8781 -0.4443 (sponza scene)
f: polygon faces that make each polygon defined as a list of vertices.vertex/texture/normal- f 147019/91297/142810 147015/91295/142806 147014/91131/142728 147022/91139/142813 (sponza scene)
s: smoothing groupvp-> Parameter space vertices in ( u [,v] [,w] )- Free-form curve/surface attributes
l# Line element (see below)
1.2. mtl (material template library)
he MTL specification, as published in 1995, includes a substantial number of options that are typically not supported in today’s software.
// sponza scene material (tail)
newmtl roof                                    // sequence of material definitions, each beginning with the keyword

	Ns 10.0000                             // specular highlights, normally 0-1000, higher value resulting in a tight,
                                               // concentrated highlight. Default is 0.0
	Ni 1.5000                              // optical density (aka index of refraction), 0.001-10. A value of 1.0 means that light
                                               // does not bend as it passes through an object

// alpha values (d = 1 means fully opaque, Tr = 0 means fully opaque
	d 1.0000                               // alpha value (aka. factor for dissolve, how much this material dissolves into the background. A factor of 1.0
                                               // is fully opaque. A factor of 0.0 is completely transparent
	Tr 0.0000                              // alpha, defines the transparency of the material to be alpha.
                                               // The default is 0.0 (not transparent at all).
                                               // The quantities d and Tr are the opposites of each other, and specifying transparency or
                                               // nontransparency is simply a matter of user convenience.

//
	Tf 1.0000 1.0000 1.0000                // transmission filter
	illum 2                                // illumination model
                                               // illum = 1 indicates a flat material with no specular highlights, so the value of Ks is not used.                                          // illum = 2 denotes the presence of specular highlights, and so a specification for Ks is required.
	Ka 1 1 1                               // ambient color 0-1 (phong reflection model/ phong illumination/ phong lighting)
	Kd 1 1 1                               // diffuse color (0-1)
	Ks 0.0000 0.0000 0.0000                // specular color

	Ke 0.0000 0.0000 0.0000                // emissive coeficient. It goes together with ambient, diffuse and specular and represents the
                                               // amount of light emitted by the material.
	map_Ka textures\sponza_roof_diff.png   // ambient color texture file
	map_Kd textures\sponza_roof_diff.png   // Color texture file to be applied to the diffuse reflectivity of the material.
                                               // During rendering, map_Kd values are multiplied by the Kd values to derive the RGB components
illum
illumis interesting, there are a number of options, but as far asWaveis concerned, there are onlytwo.Illumination Properties that are turned on in the model Property Editor 0 Color on and Ambient off 1 Color on and Ambient on 2 Highlight on 3 Reflection on and Ray trace on 4 Transparency: Glass on Reflection: Ray trace on 5 Reflection: Fresnel on and Ray trace on 6 Transparency: Refraction on Reflection: Fresnel off and Ray trace on 7 Transparency: Refraction on Reflection: Fresnel on and Ray trace on 8 Reflection on and Ray trace off 9 Transparency: Glass on Reflection: Ray trace off 10 Casts shadows onto invisible surfaces1.3. textures
- JPG and PNG are known to be supported.
References